DO variables and response variables
Predicting consumer response In the previous post I discussed how it is possible to compress our knowledge...
Predicting consumer response
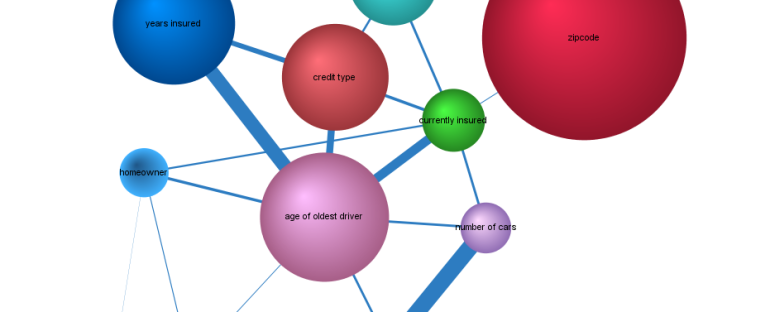
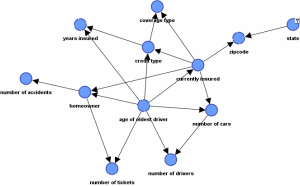
In the previous post I discussed how it is possible to compress our knowledge of auto insurance lead consumers into a very compact model. A Bayesian Network, shown here, was derived from lead data. The model describes the dependencies among lead variables. Variables are needed to describe consumer Experience and Response.
To predict consumer conversion (from visit to completed lead) the model needs more variables. Response variables are measurable consumer actions on the web site. Usually this data comes from log files or more often from the use of web beacons. Common responses are Ad Click In, Landing page view, form completion and Ad Click Out. Revenue generating responses are obviously most important. So too are responses that incur costs (Ad Click In). Intermediate responses, like Form Started, Second Form Complete, are also very important, especially in a multi-stage form which are often used in auto insurance lead forms (due to long and varying form length).
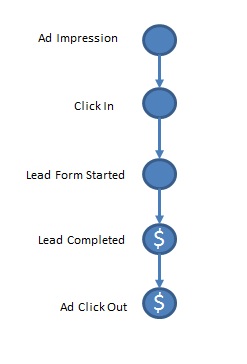
Some response variables must occur in proper temporal sequence: an Ad Click happens after an Ad View or Form Start must happen before a Form Complete. In most cases a series of variables will produce a “causal chain of events”.
 Response variables
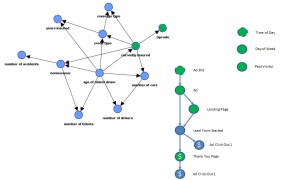
In our example of the lead gen business, response variables might look like this picture. This causal chain of events actually links our variables in a way that will reduce the complexity of our model. This toy model is made with just 5 small tables. Calculating the probability of a Lead Completion given an Ad Impression is simple.
Notice that our knowledge of the causality among variables allows for a compressed model.
In our example there are two responses that produce revenue. The amount of revenue depends on many things. The Book of Orders and lead matching play a huge role in this. Calculating revenue is reserved for part 3 in these blogs.
Do Variables
Do variables are the things we can Do to change the consumer experience. The first example is Ad Impression. In our case we might have many Ads that can be shown. I really like the language adopted here because we can ask the question: “What Ad do we DO to get the greatest Click In?” or simply “What do we do?”
Interventions are the key to optimizing performance of the business. Do variables are the interventions that are at our disposal to change the consumer experience so that their response produces maximum profit for the company. It is interesting that this measure of Utility is very close to what consumers want : to buy insurance.
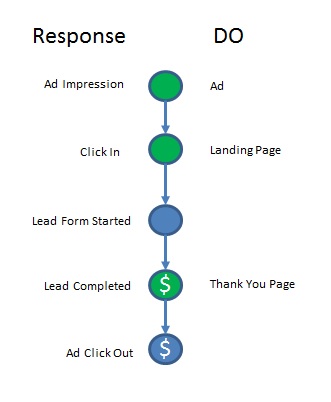 Combining Response variables and DO variables is a compact representation. So instead of using the variable Ad Impression with values {T,F}, we will use the variable Ad with values {F, Ad1, Ad2, …, Adn}. Likewise instead of using Click In, we can use a more powerful variable that embodies inbound clicks and describes the landing page experienced by the consumer. Since we can intervene and show any Landing Page, Landing Page is a Do variable.
This is probably an oversimplified model. Most direct marketers know that different ads seem to affect the Form Start rate and even form completion rates. So given a large set of data, some additional links among variables might be added. I think the new links must always point down.
Since both types of variables ‘overlap’, I like to group these variables together and call them simply Response variables. Imagine another variable – Ad Bid. It is a Do variable, but since it would be so directly tied to consumer response, it is included it in the Response variable set. It also allows us to Do, since we can change our bid.
From response data collected from a web site and user data collected in the form process, a Bayesian Network can be learned. The resulting model will show how user variables might affect response.
All known predictive variables should be included too. Some of these variables are discovered from past experience or expertize. They might include temporal statistics like Time of Day, Day of Week, Holiday. Other variables might be environmental variables know to affect conversion. Statistics derived from any past user experience are helpful too.
A more complete model
Here is a collection of variables that could make a prediction model for the lead gen business. The variables of the sub-models are not yet connected, which is done by processing user data from forms, user response and external variables. I use BayesiaLab software to find models from data. It is easy to learn and use and is full of important features. I recommend it.
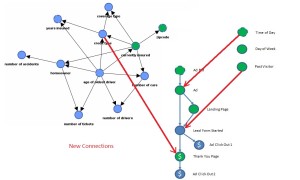
The learning process may find new ‘connections’ between variables, such as Ad and Time of Day, or Age and Lead Form Started. The learning process seeks out nodes (variables) with high mutual information. And the learning algorithms seek to balance improved fit with data and reducing model complexity. More connections means higher complexity (more parameters required to estimate). So the algorithms seek the best fit with the least connections.
Sometimes clustering variables can improve prediction accuracy. So imagine that users are clustered in such a way that increased mutual information with the cluster and Lead Form Start. It would then be possible to DO the best Landing Page for the most probable Cluster. Clustering will be saved for another post.
A final model might look like this. The red lines are connections made to response variables. In this fictitious example Credit Type is found to have a direct influence on conversion to the Thank You Page, Time of Day influences clicks on Ads, and having been a Past Visitor affects Form Start rates.
An interesting note on the direction of these connections. Visiting the web site cannot influence the time, nor can responses to a web site cause a person’s age. Likewise Time of Day may affect click-through rates and age may affect how a particular user might respond. So links to the response variables will always be inbound links. This constraint can speed learning time.
This fictitious model requires 20 small tables of parameters (conditional probability tables) to estimate the probability of conversion of Ad Click Out 2, the same 20 tables (less one table) to calculate Thank You Page (completed lead) conversions and only 6 tables to calculate Ad Click Out 1 rates.
Simplicity at last!
In this model once Credit Type is known, then the model can be ‘mutilated’ in a way that ‘cuts off’ the need for all of the user data for conversion prediction. This vastly reduces the complexity of the problem! Do calculus is wonderful in this way. In BN models, a variable embodies the information of all its parents. So once the value of a variable is known, then the parent node values become superfluous and can be removed from the model. The model is simplified by ‘mutilation’ or ‘graph surgery’.
So, given 20 conditional probability tables, and a graphical model, one can make predictions of any of the user response variables. We can make predictions without knowing any user variables. But, once we know some information about the user, prediction calculations become easier and require fewer and fewer parameters. Optimizing ad buying will be easier too.
If we were trying to maximize Thank You Page (completed lead) conversions then our problem would be finished. We can create Do Policies that maximize conversions. At each step in the process we can intervene, we ask: “Given what I know, what do I Do”? We can only Do certain choices, each of which renders (using our tables) a probability of conversion. We pick the Do with highest conversion (or pick among the highest).
This is the least complex model I know of this terribly complex problem. Probabilistic graphical models can vastly simplify problems. They do this by compressing knowledge into graphical representations which offer great versatility. Using information science and Pearl’s calculus the solution becomes practical.
The problem is not yet finished. Companies have monetary goals like profit, profit margin and ROI. In the next blog I’ll talk about the revenue part of the problem and offer a solution to the optimization of profit. Lead revenue is generated when a consumer lead is matched with an order (or orders).
Part 3 – Using the current Book of Orders an a Bayesian Network to optimize Profit.
About The Garden
People are hungry in Edmond, Oklahoma. It is our hope to provide a source of nutritious fresh food by serving local food banks.
The garden sits in the bottom of Chisholm Creek and shows great promise with great top soil and a nice flat 1/2 acre for cultivation.
Recent Posts
-
Good High Value Home Insurance: Options and Plans
EconomicsOver a long and lucky life I have accumulated a lot...
-
Fundamental Equation of Business Potentials
Bayesian Networks, EconomicsSince I was a student of mechanics and physics a better...
-
Have you ever seen mountains?
In the Weeds, The Garden BlogWhat is this monster slouching towards Bethlehem from...
DO variables and response variables
About Elm Tree Garden
People are hungry in Edmond, Oklahoma. There were times as a child that I was hungry. People don't get enough fresh vegetables. It is my hope to provide a source of nutritious fresh food to my community of local food banks, kitchens, friends and family.
The garden sits in the bottom land of Chisholm Creek and has great top soil and a nice flat 1/2 acre for cultivation. We have added a water well, irrigation and electricity.
The setting is my favorite reason to garden here. The old elm tree shades a nice sitting area from which to view the garden and the rich nature that comes and goes in the bottom.
From The Garden Blog
-
Good High Value Home Insurance: Options and Plans
EconomicsOver a long and lucky life I have accumulated a lot...
Best Production So Far
- Sweet corn - 700 ears
- Onions - 150 pounds
- Garlic - 50 heads
- Red Shallot - 50 lb
- Cantaloupe - 50
- Peppers - 25 boxes
- Summer Squash - 3 boxes
- Tomatoes - 15 boxes
- Okra - 25 boxes
- Green Beans - 8 boxes
- Blackberries - 6 boxes
Give to Food Banks
Even in prosperous Edmond, food banks do a steady business serving the poor. Most efforts are operated by volunteers. They almost always need help. Please give cash or volunteer.
Great examples:
Regional Food Bank: where you can donate or volunteer.
Other Options, Inc. in OKC
Project66 Community Food Pantry in Edmond

